LIGHT-DATA
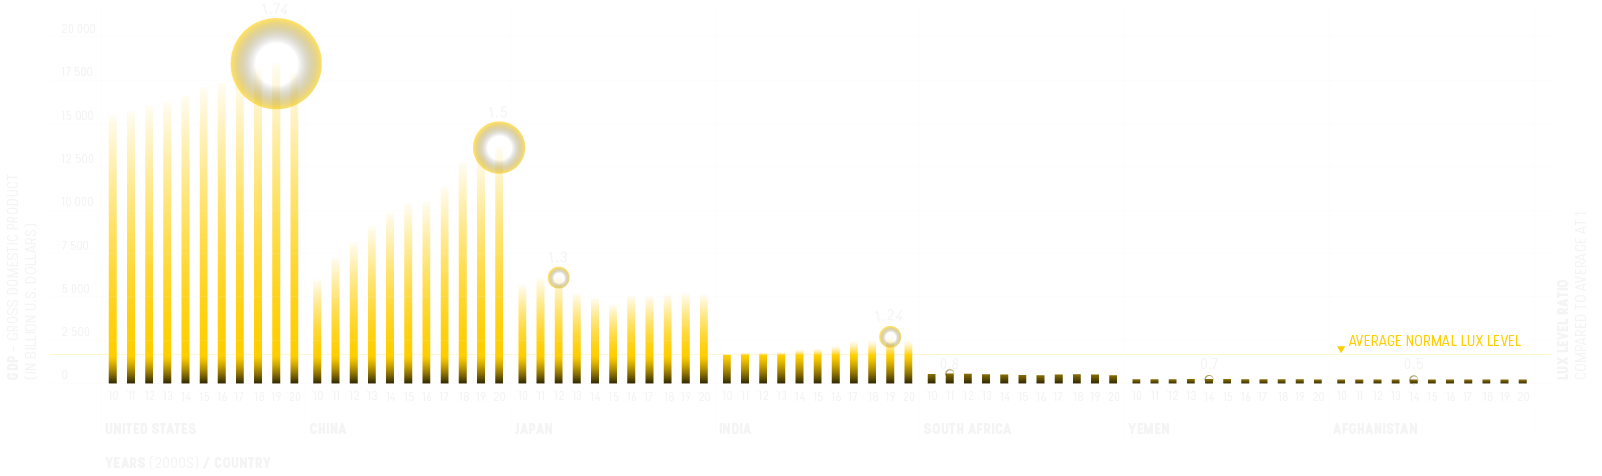
To better understand the relationship between a country’s standard of living and the amount of light it is producing, I had to collect and cross reference 2 sets of data;
Data Visualisation


Findings
INSIGHTS AND CONCLUSION
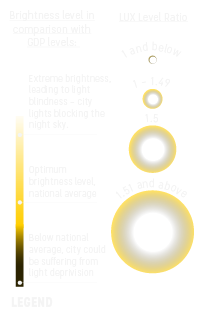
However both scenarios each have their own advantages and disadvantages, with the megacities shining ever so brightly, the people and animals living there would feel the impact of the city’s light pollution. Biological clocks of both humans and animals alike would be affected, our body’s physiological processes are disorientated, resulting in a number of health issues like insomnia, fatigue, and increased stress, to name a few.
References
- "Earth At Night". Earthobservatory.Nasa.Gov, 2016, https://earthobservatory.nasa.gov/features/NightLights/page3.php.
- "The Age Of Megacities". Arcgis Storymaps, 2021, https://storymaps.arcgis.com/stories/a900831b442e43c79cf9eeb399d5440f.
- Buchholz, Katharina. "Infographic: The Biggest Economies In The World". Statista Infographics, 2020, https://www.statista.com/chart/19489/biggest-economies-in-the-world/.
- Cheng, Gwyneth. "A Rising Star". Kontinentalist, 2021, https://kontinentalist.com/stories/light-pollution-effects-put-singapore-and-hong-kong-on-the-map.
- Evans, Cindy, and Will Stefanov. "Cities At Night: The View From Space". Earthobservatory.Nasa.Gov, 2008, https://earthobservatory.nasa.gov/features/CitiesAtNight.
- Kadaba, Dipika. CARTO, 2018, https://dipika.carto.com/tables/urbanlightpollution_world/public.
- Kadaba, Dipika. "Big Cities, Bright Lights: Ranking The Worst Light Pollution On Earth". The Revelator, 2018, https://therevelator.org/cities-ranked-light-pollution/.
- O'Neill, Aaron. "Afghanistan - Gross Domestic Product (GDP) From 2006 To 2026". Statista, 2021, https://www.statista.com/statistics/262048/gross-domestic-product-gdp-in-afghanistan/.
- O'Neill, Aaron. "South Africa - Gross Domestic Product (GDP) 2026". Statista, 2021, https://www.statista.com/statistics/370513/gross-domestic-product-gdp-in-south-africa/.
- O'Neill, Aaron. "The 20 Countries With The Largest Gross Domestic Product (GDP) In 2020". Statista, 2021, https://www.statista.com/statistics/268173/countries-with-the-largest-gross-domestic-product-gdp/.
- O'Neill, Aaron. "The 20 Countries With The Lowest Gross Domestic Product (GDP) In 2020". Statista, 2021, https://www.statista.com/statistics/256547/the-20-countries-with-the-lowest-gdp-per-capita/.
- O'Neill, Aaron. "Yemen - Gross Domestic Product (GDP) 1996-2026". Statista, 2021, https://www.statista.com/statistics/524134/gross-domestic-product-gdp-in-yemen/.